The Worst 20 Days

Amar Pandit , CFA , CFP ![]()
January 10, 2023 | 5 Minute Read
Missing the Best 20 days is one of the most favourite charts in the asset management space. I am sure you would have come across this at some point of time whether in a presentation, article or seminar. I have spoken about this too and had done a post “The 20 Best Days in the Last 20 Years” in July 2020. While there is a lot of literature on what happens to your returns if you miss the best 20 Days, I have not seen anything on what happens if you miss the worst 20 Days. So, I thought of doing a data driven post on this topic to see if there were any hidden nuggets of wisdom. And did I find any? You are about to find that out soon.
Alert: Fasten your seatbelts as you are about to see a lot of numbers. I understand this can be overwhelming, so I have tried to keep it as simple as possible.
Let’s take a look at 2 sheets. The first sheet has 2 tables. The first table gives you the details of the compounded annual returns of the last 20 years as well as the returns if you had missed the best 20 days (from 1st January 2002 – 31st December 2021). The second table gives you the best 20 days along with their dates and daily absolute returns.
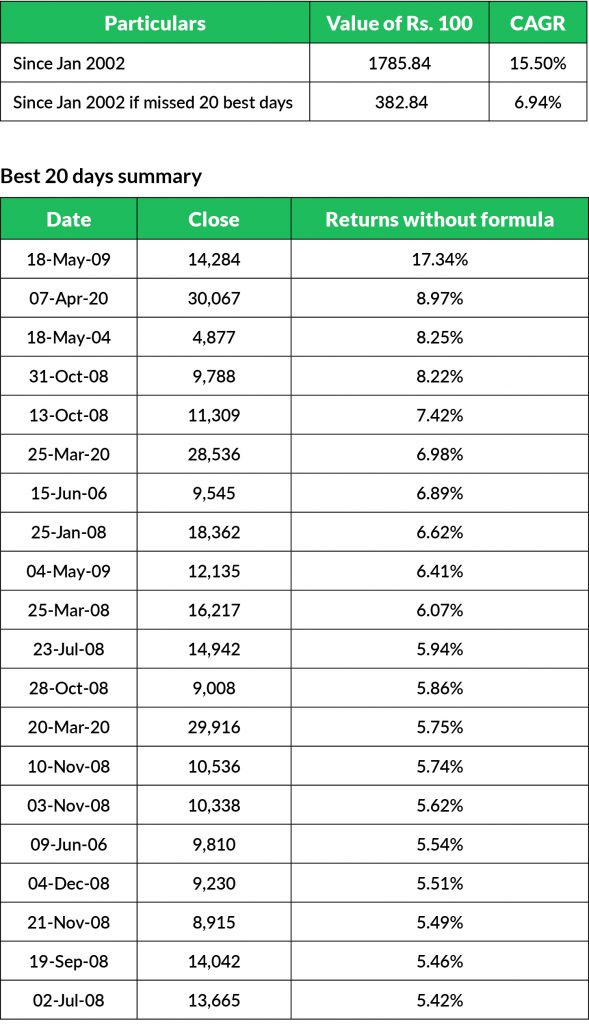
As you can see from the sheet above, the CAGR (Compounded Annual Growth Rate) for this has been 15.50%. However, if you missed the best 20 days, the CAGR would go down to 6.94% (a gap of almost 8.56% p.a.). The gap is huge.
Digest the numbers for a bit before we move on to the second sheet.
Now this sheet has 3 tables.
The first table gives you the details of the compounded annual returns of the last 20 years as well as the returns if you had missed the worst 20 days (from 1st January 2002 – 31st December 2021). The second table gives you the worst 20 days along with their dates and daily absolute returns. There is a third table in this sheet that compares the number of best and worst days in their respective years. This is an interesting one so look at this one in particular carefully.
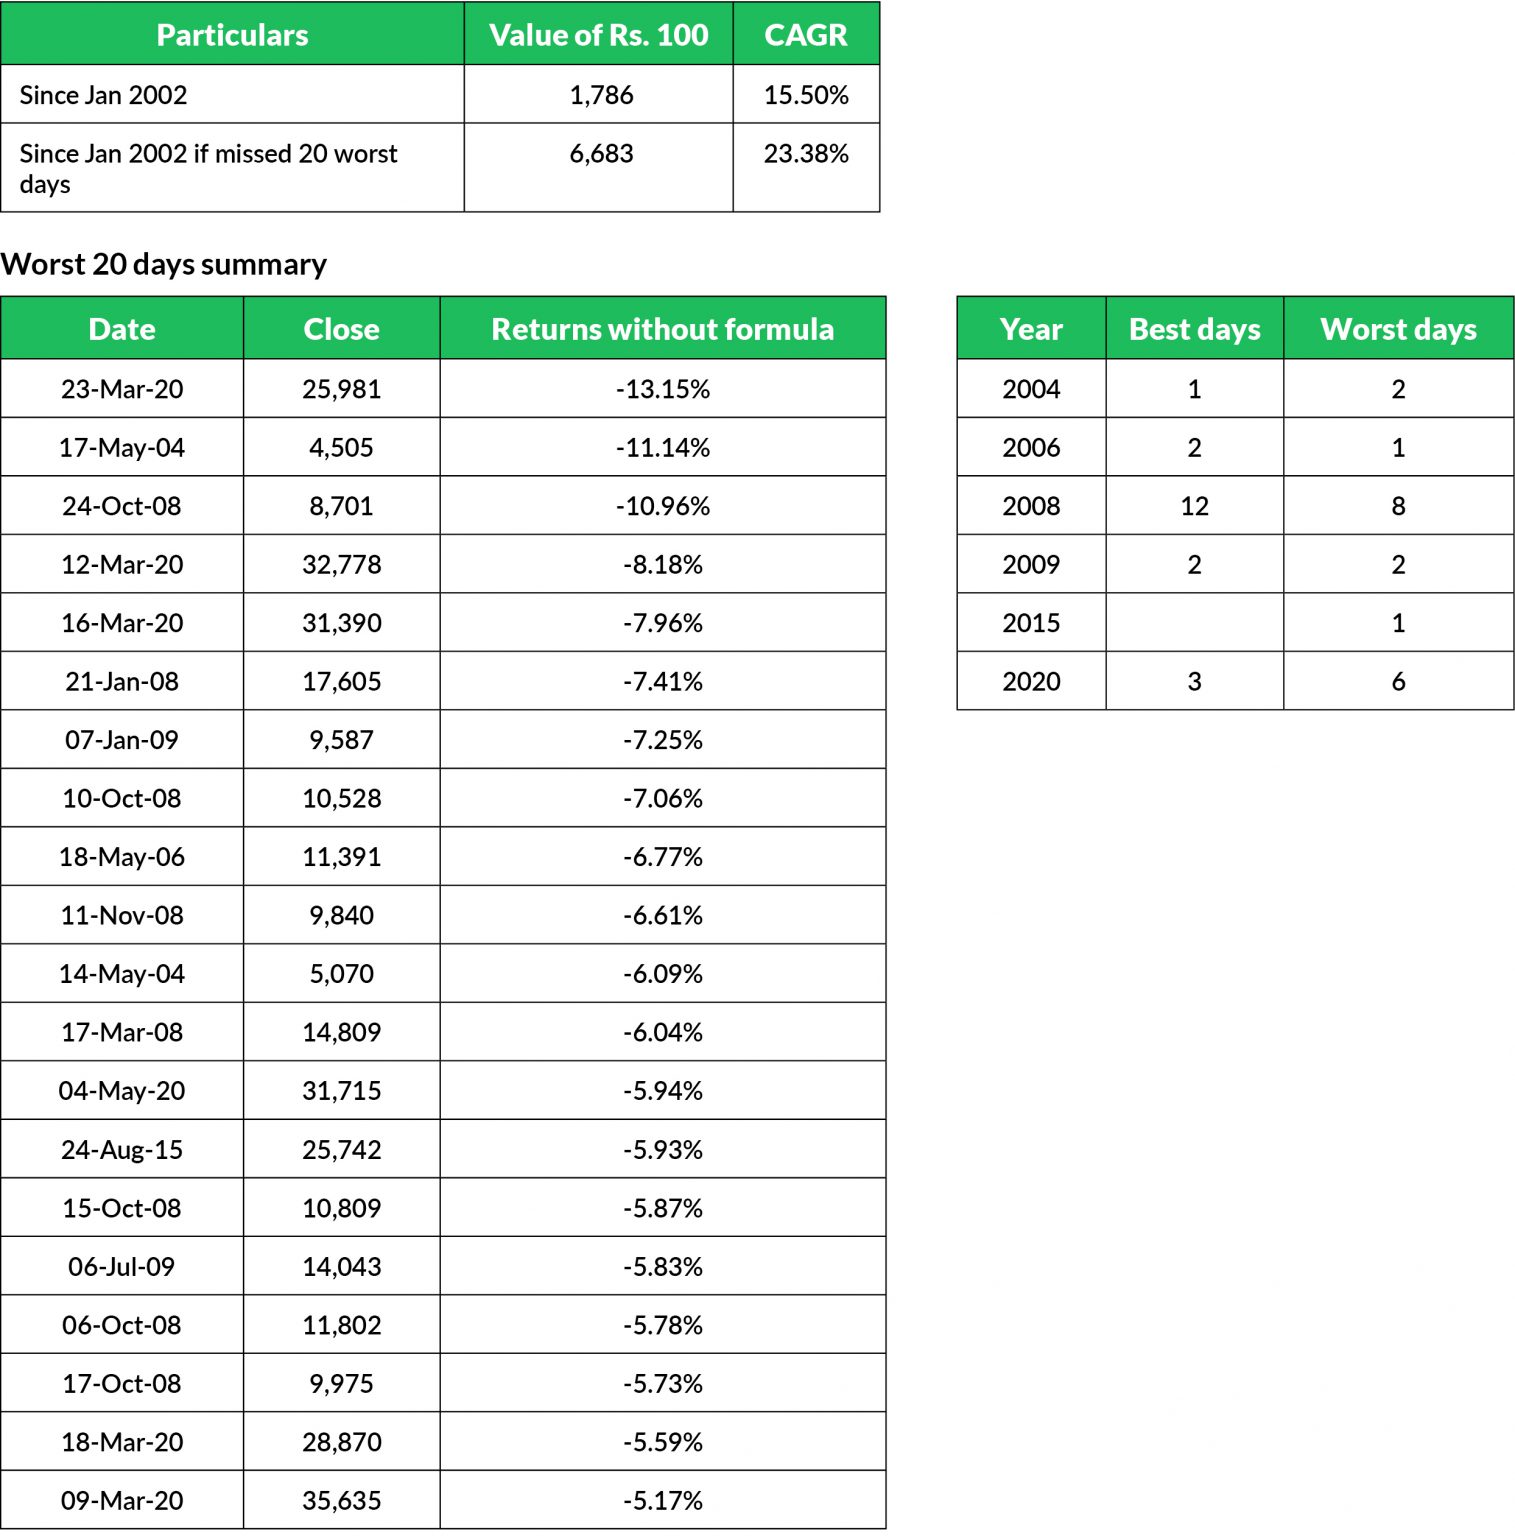
As you can see in above, the CAGR for 20 years is the same as in the first sheet. The number is 15.50%. However, if you had managed to miss the worst 20 days, your CAGR would jump up to 23.38%. This is a significant gap of 7.88% (23.38% – 15.50%).
Avoiding the worst 20 days would have delivered an additional 7.88% p.a.
Did you know that?
I have not seen many people knowing this number while intuitively knowing that there is some gold in trying to avoid the worst days. Thus, we resort to market timing or look out for people who possess this skill. And this is exactly where we fall into the market timing trap.
The third table (as well as the second tables from both sheets) will help destroy the market timing argument.
As you can see carefully in the third table, the best days and the worst days are in close proximity to each other. The years 2008 and 2009 (anyone remember the global financial crisis caused by greedy crooks from reckless financial predators) have the maximum number of worst days as well as the best days.
Can you believe that there were 10 worst days in those 16+ months of 2008-2009?
Yes, this is very easy for all of us to believe.
But could you imagine that the best 14 days would also turn up in the same period?
I bet many of you didn’t.
Let’s zoom in a bit with yet another example from the above sheets.
Between October 2008 and November 2008, there were 6 days of the worst returns of the last 20 years.
Guess how many days with the best returns in those same 2 months?
You got it right this time. The Answer is 6.
If this is true (which it is), how on earth can you actually time the markets even if anyone had godly powers?
How would it be possible to get into the stock market on a certain day and then get out after a few days/weeks and then again get in?
Do you think it’s possible?
It’s absolutely not and anyone who tells you that he/she can do this is simply a bullshitter. Yes, you can rebalance a portfolio and sell high and buy low (by sticking to an asset allocation) but there is simply no way to accomplish the feat of market timing.
The truth is that there is simply too much noise during such turbulent times.
And many end up exiting the market thinking they will get back in later. Many who even have money to invest wait for the market to settle. They wait for the Right Time when the Right Time is Right in front of them.
To avoid the worst days, people end up missing the best days too.
Being out of the stock market or waiting for the stock market to settle during tough times is like waiting for the rainy season to end before you step out of the house. All you need instead is an umbrella.


 and then tap on
0 Comments