The Next 3 Trillion

Amar Pandit , CFA , CFP ![]()
June 15, 2021 | 7 Minute Read
The headline of this post might have sparked a question in your mind “What’s the first 3 trillion?”. If it has not, that is perfectly alright. Let me tell you about the first 3 trillion.
The Trillion in the headline refers to the Market Capitalization of the Indian Stock Markets.
Market Capitalization (Market Cap) essentially is the market value of all the stocks listed in the stock market.
The Market Cap formula for 1 company (stock) is as simple as: number of shares outstanding of that company(stock) * current market price of the company.
Market Cap of Stock Market = Sum of Market Cap of all the Companies in it.
Another technical point to understand is that Market Cap generally mirrors the GDP of the Country (sometimes it is way ahead and sometimes it is behind) but more or less you can make a rough (rather rudimentary) assumption that the stock market cap of a country should be at least equal to the GDP of a country.
If you look at the US stock market capitalization as on 31st March 2021, it was close to $50 trillion whereas it is GDP before COVID-19 was around $20+ trillion.
This means the Stock Market Cap /GDP Ratio is 2.5. There are some interesting thoughts that have come to my mind as I write this but more on that in another post.
Coming back to the first 3 trillion, Indian Stock Market recently made headlines for crossing $3 trillion dollar of market cap.
Look at the interesting visual below:
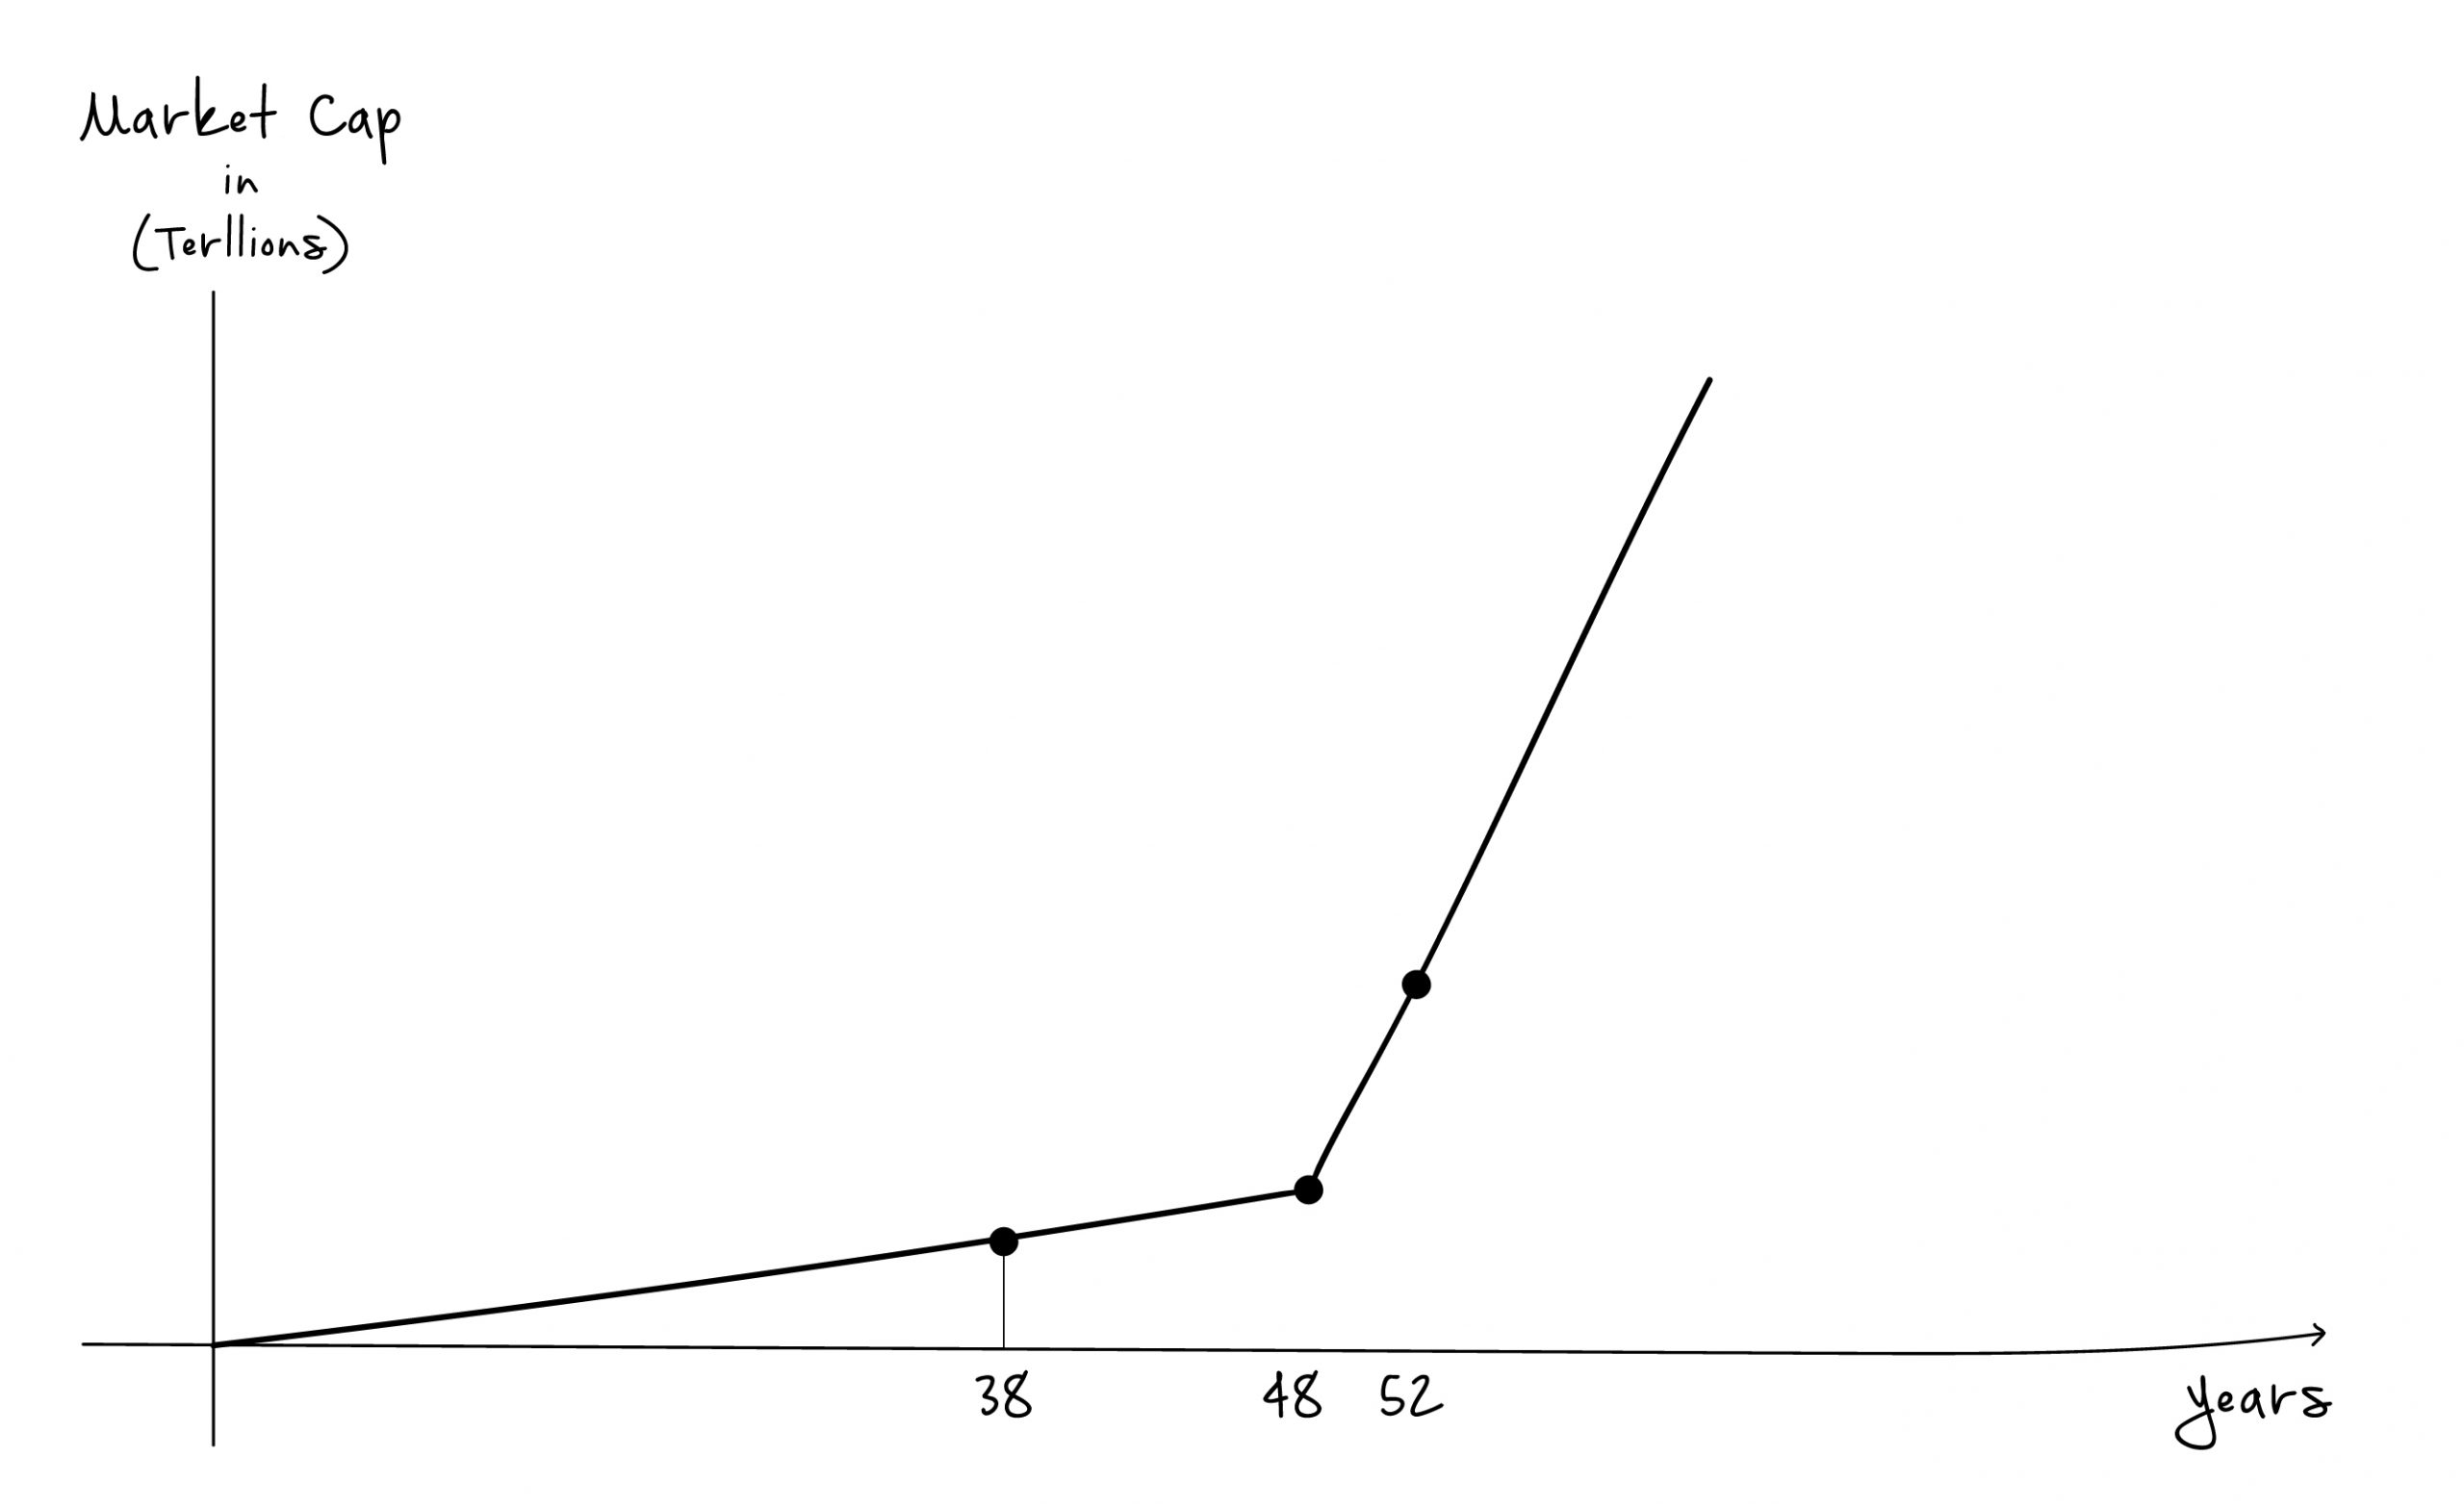
We crossed the first Trillion on May 28th, 2007. We crossed the second Trillion on May 16th, 2017, and the third Trillion on May 24th, 2021.
The first trillion took 38 years. The second one took 10 and the third trillion took just 4.
Isn’t this fascinating?
This is nothing but compounding at work.
How many years do you think will the fourth trillion be in? My sense is that the number should be lower than 4.
Similarly, if it took 52 years for the first 3 trillion, how many years do you think it will take for the next 3 trillion? One thing for sure, it is going to be a lot faster than we might think.
According to different studies and projections, India can hit $10 trillion in GDP by 2030. Even if I take a Stock Market Cap/ GDP Ratio of 1, this will mean a $10 trillion Stock Market Cap from here. This is 3.3 times of the current market cap. This means a Sensex at 52000 * 3.3 = 171,600.
If we assume a higher or lower Stock Market Cap/GDP Ratio as higher or lower than 1, then we can have wildly different numbers.
Before you proceed further, let me be very clear. This is not a prediction of any sort. I am not also getting into any debate whether it is too low or too high. It is only a projection done to explain a concept and help you visualize it.
Let us assume for a minute that the Sensex does hit 171,600.
Now ask yourself this question and reflect over it.
What difference does it make if I invested at 52000 or 40000?
The key point here is not whether you invested at 40000 or 52000 but it is whether you are going to stick to your investment all the way from 52000/40000 to 171,600 and beyond. Even if you invested at 40000 and I invested at 52000 and we both stuck all the way to 171,600, the difference in our returns is just around 0.7% p.a. Are you going to seriously obsess over this difference of 0.7%? Now you can endlessly debate 0.7% matters but the people who do this normally end up missing 70% for 0.7%.
Look at this visual:
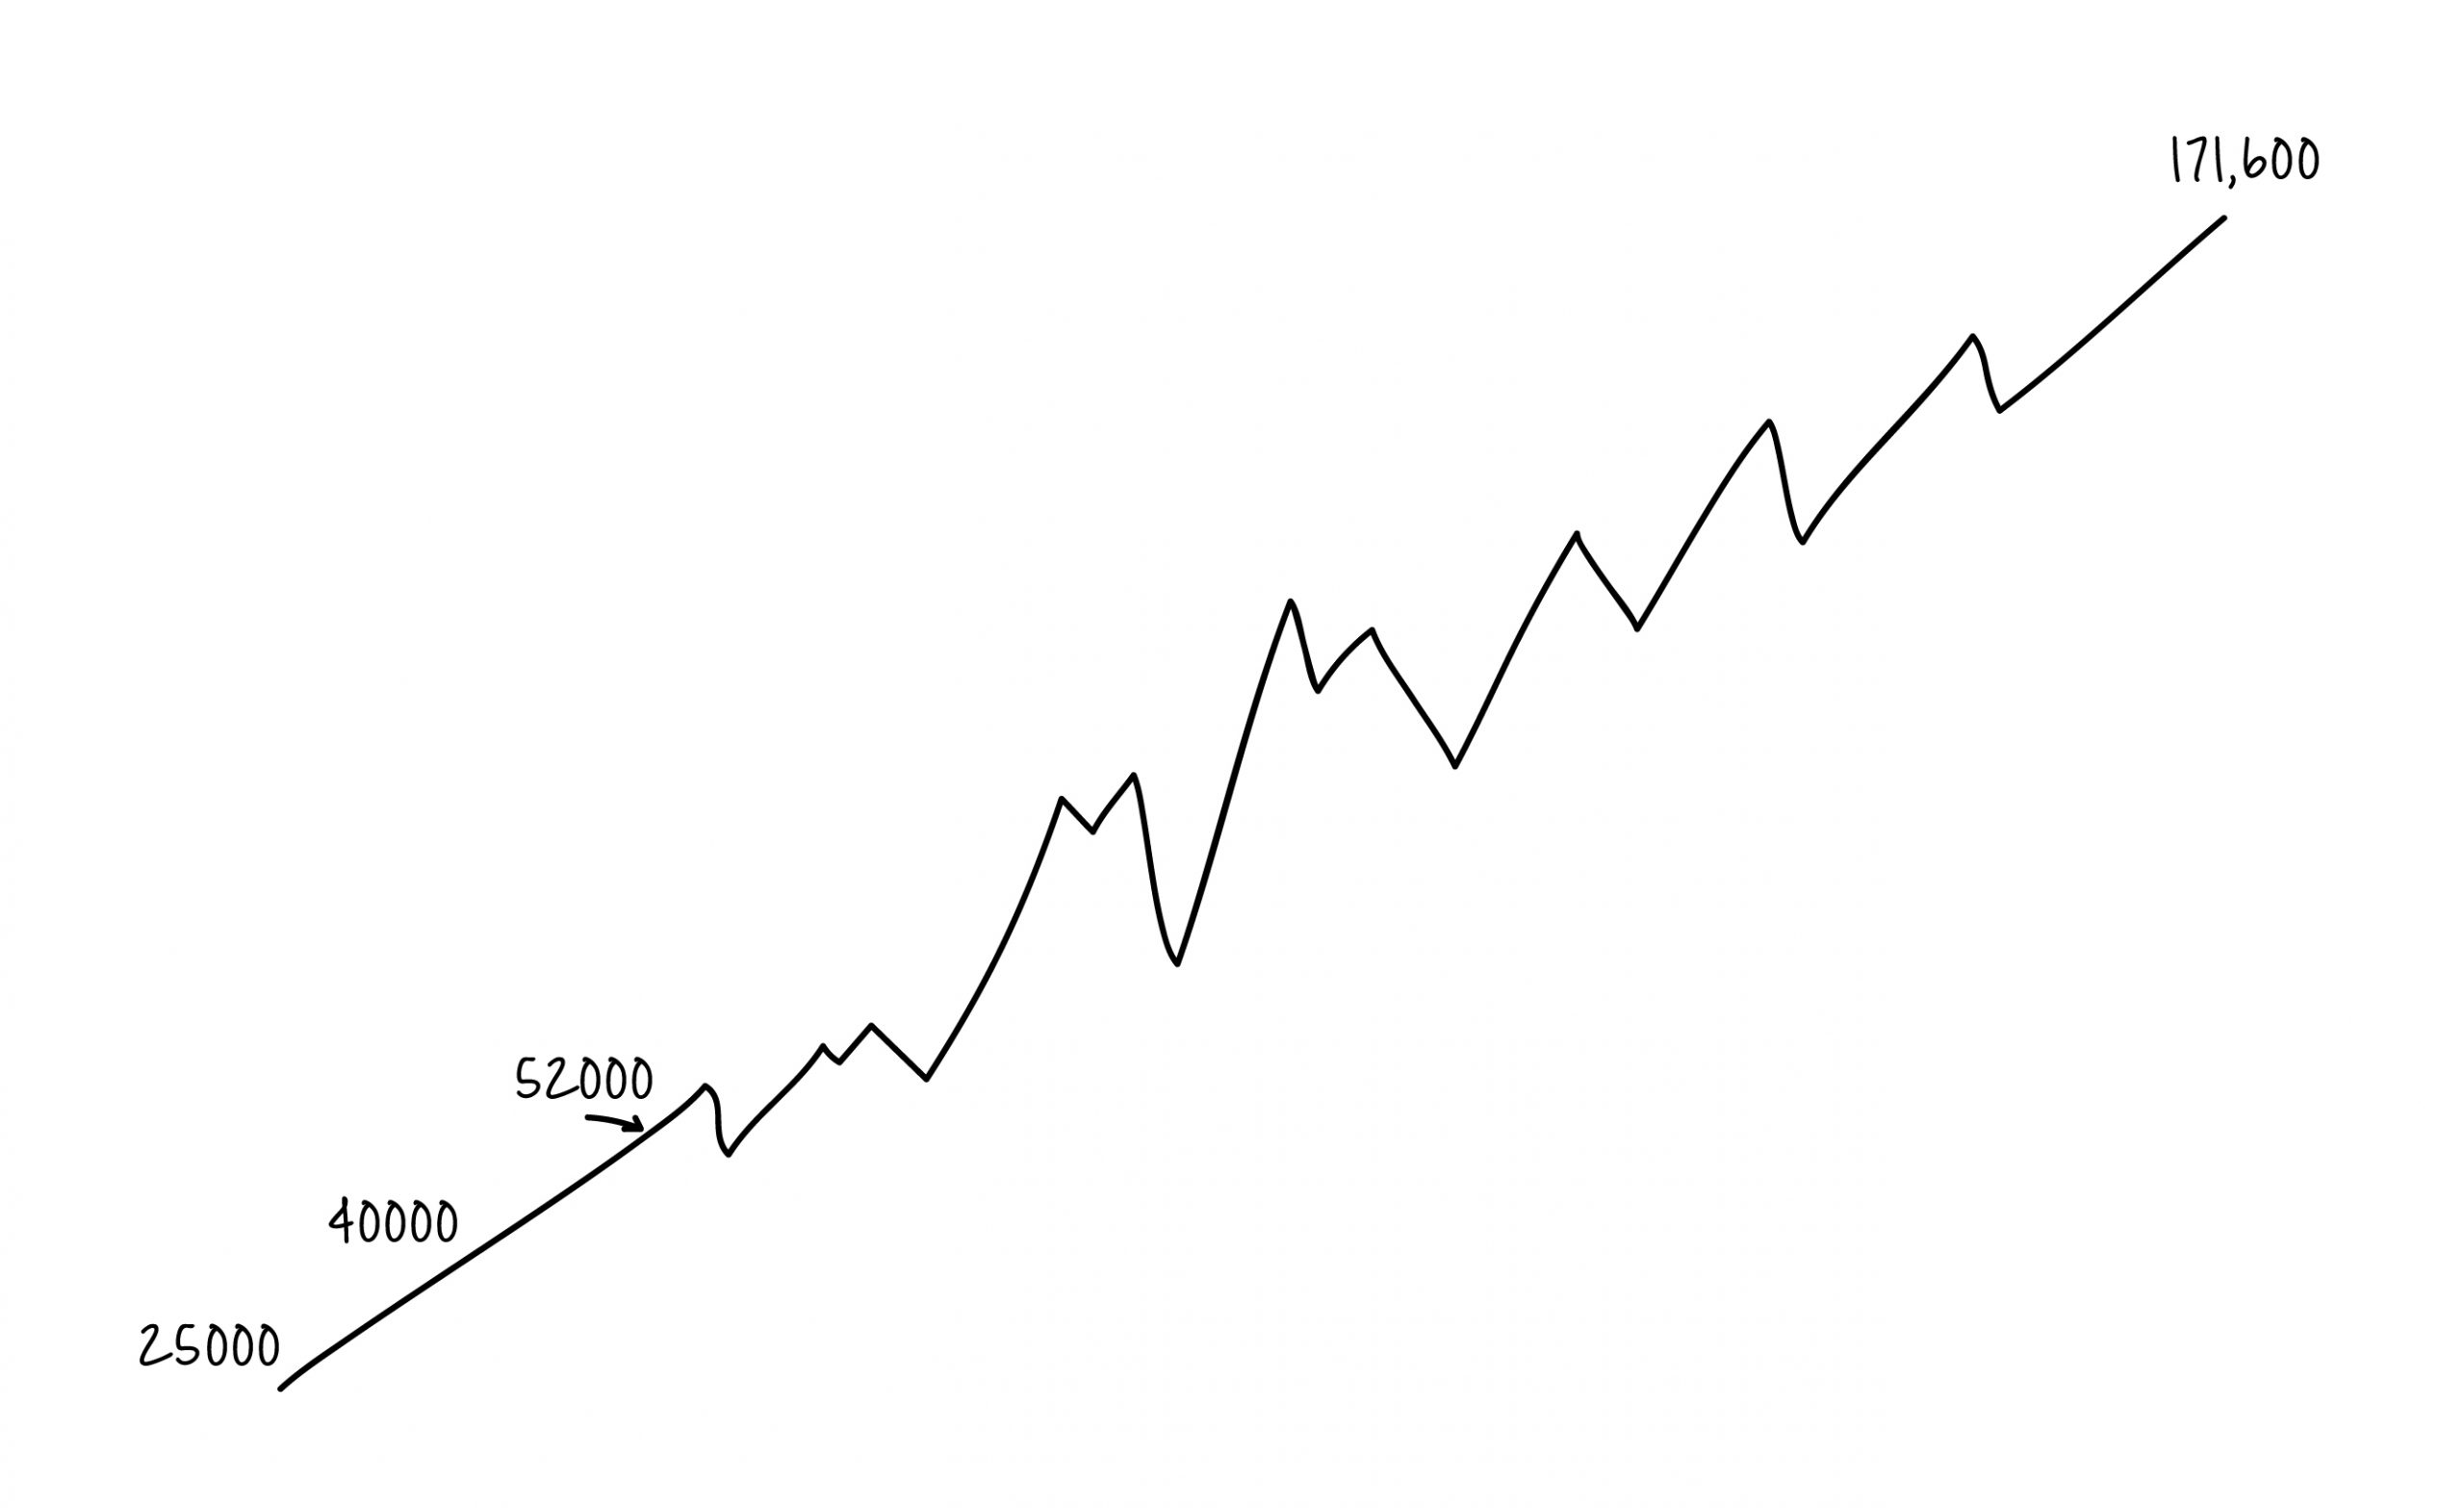
If you are not going to invest today thinking the market is high, you are indulging in market timing and speculation around prices. You think you will be out of the market during its worst days, but you will also miss the best days of the market, which often follow the worst days. In short, the chances of you sticking to the simple straight journey as shown in the above visual is minimal.
This is because you will want to avoid the emotional pain of being invested during corrections and crashes. However, the wise investor knows that this is the price everyone must pay along the journey from 52000 to 171,600 or from 40000 to 171,600.
The lessons to be learned from the first 3 trillion are:
a. Every subsequent trillion is likely to be faster than the previous one.
b. This exactly mirrors the compounding curve, and the power of compounding is available for all of us to us.
c. No matter what the market corrections or crashes are, the next trillion will happen and so will the next. No matter what the gloom and doom scenarios are, the next trillion and the next several trillion will happen.
The point is “Are you in for the ride?”
Predicting the next trillion is futile and obsessing over when to invest is a complete waste of time. The important part is whether you rode the ride from 0 (or anywhere you started from) to $3 trillion. The lesson to learn and implement is to ride the rollercoaster from $ 3 trillion to all the future trillions.


 and then tap on
0 Comments