The Best Stock Market Timer in History

Amar Pandit , CFA , CFP ![]()
December 20, 2022 | 5 Minute Read
Last week’s post was about the Worst Stock Market Timer in History. This week I thought of writing about the Best. However, I thought of doing this through the context of Corrections.
Many investors fear or worry about corrections. Thus, they try to do everything they can to avoid corrections as best as they can. If they can’t achieve this feat on their own, they start looking for people who they think can. In short, they look for people who they believe can time the markets.
On the other hand, many financial professionals are also afflicted with this problem. They think their job is to offer predictions on corrections as this will demonstrate their value to investors. A nicer way of saying this is that they protect people from these corrections. They fall in this trap themselves and get their clients stuck in it too.
Why am I calling this noble effort a trap?
Because professionals as well as investors think that they are different and can make it work but the reality is, it never works consistently. Yes, you read it right. Predictions or protecting people from corrections or market timing never works consistently.
Why?
Because you have to be right twice.
You read it right, again.
You have to be right twice. Once by getting out of the stock market right before it falls, which itself is a near impossible feat (except with luck). And you will see why the feat is impossible based on the data I am going to share with you shortly. But let’s assume that you have some superpower, and you manage to get out every time (which is at least once a year) right before a correction happens. Even if you achieved this somehow, you now have to be right about entering the stock market again.
But by now, you (the financial professional or the investor or both) are gloating about your perfect call that you end up waiting too long to get back in. You brag about this – I managed to get out on time and in the process miss getting back in. We see this quite regularly. People who get out in time seldom get back in time. Thus, a lot of money is lost trying to predict or avoid corrections. The Peter Lynch quote that I had shared in a previous post simply rings a loud bell here – “Far more money has been lost by investors preparing for corrections or trying to anticipate corrections, than has been lost in corrections themselves.”
Why do we fear or worry about corrections so much?
We all understand corrections at an intellectual level, but when we are in the midst of a sharp one (and there is too much noise), we tend to forget that corrections are as normal as passing clouds or thunderstorms.
They are simply a normal part of stock market investing. And they happen every year (one or more). You simply cannot avoid them.
Let me ask you a question now.
How many corrections do you think have happened in the Sensex over the last 43 years from 1980 till 2022?
Well, I have already given you a more than generous hint of the answer so that might be easy.
More than 43, you might say.
Now let’s qualify this further.
How many corrections have happened in each of these 4 categories over the last 42 years?
a. 10-20% fall
b. 20-30%
c. 30-50%
d. 50% +
Now this might be a little more challenging. Think about it for a minute before I share the data with you.
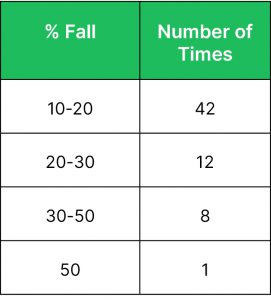
As you can see above, there were 63 corrections in the Sensex over the last 40 years. This is approximately 1.5 (63 divided by 43) on average per year.
Note this number – 1.5 Corrections per year.
Of these 63 corrections, 42 have happened in the 10-20% range at an average rate of 1 per year. Hence it is normal to expect at least a 10-20% fall in the Sensex every year.
A 20%+ correction is typically called a bear market, and as per the data above there has been a bear market type correction (12+8+1/63) in the Sensex 33% of the time.
But there are 2 important points that you must etch in your memory.
1. There have only been 4 years in the last 43 years without a correction. The market has simply gone up in one direction in each of these 4 years. A scenario that many would love (or rather expect) but note that this is indeed a rare occurrence. And has happened 4/42 or 9.5% of the time.
Can you guess the years?
2013, 2014, 2017 and 2021.
2. The most important point is that despite a 1.5 correction on average every year, the Sensex delivered positive returns in 33 out of 43 years which is 77% of the time.
Isn’t this mind blowing?
Despite the corrections, the market has been up in these many years.
So, what does this all tell you?
That Corrections are normal and healthy. They are common. There will be many more over the next 40 years too.
They are a necessary force, a detoxing mechanism of the stock market (from time to time) to shed its excesses, so that it can resume its up move.
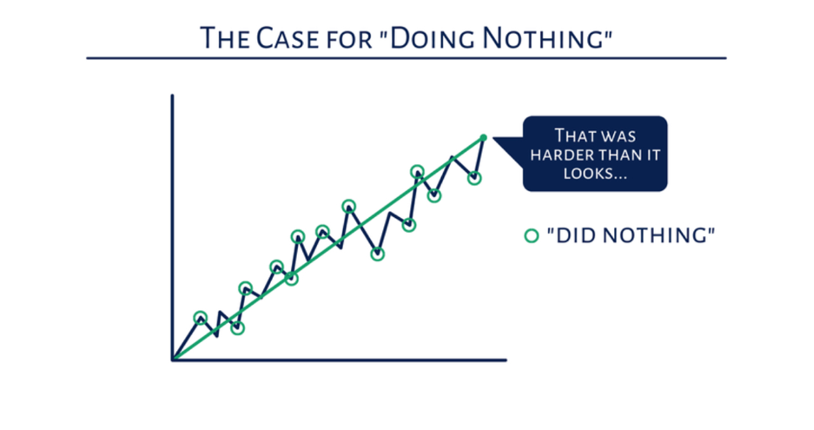
So, what should you be doing if you are in the midst of one?
I am sure you know the answer or have figured the answer by now. But the visual below sums up the action.
What about the best stock market timer in History? Wasn’t this post about this person?
Yes, it was, but haven’t you already figured the answer?
There is no living or dead person with such capabilities. And more importantly even if there was one, it simply doesn’t matter.
What matters is that you stay the course and never interrupt the compounding cycle.


 and then tap on
0 Comments