The 200X Fund

Amar Pandit , CFA , CFP ![]()
October 12, 2021 | 6 Minute Read
I generally do not write about specific funds but the insightful lesson and thoughts for investors in this particular fund surely makes for an interesting read. I hope you enjoy this as much as I enjoyed writing it. There is a lot that I had written but then edited as much as possible to keep the essential elements intact.
Last week, I came across this fascinating advertisement from Nippon India Mutual Fund. The advertisement contained the following “Rs.1 Lakh has grown to Rs.2 Crore in 26 years. 200 Times Growth!” The fund in question is Nippon India Growth Fund formerly known as Reliance Growth Fund.
I found the creative fascinating, so I asked a few investors this question – “How much do you think a fund that grew 200X in 26 years delivered on an annual basis to achieve this growth?” I got answers all the way from 50% to 100%+. I was not surprised to hear them as many investors do not intuitively get the power of compounding. Even the sharpest mathematical minds do not.
The correct CAGR (compounded annual growth rate) is 22.72% since inception. To give a context, Warren Buffett’s Berkshire stock has averaged a CAGR of 20% per annum since 1965. From 1995 though (year of inception of Reliance Growth Fund), the Berkshire stock has gone from an average stock price of $25517 to $404210 (rather 15.84 times or 15.84X).
One of the world’s best and well-regarded investors delivered approximately 16X return in 26 years. On the other hand, an Indian mutual fund scheme generated a 200X return in the same time frame. It is indeed a spectacular achievement. There is no doubt about this at all. However, beneath this fund performance lies a hard-hitting lesson that applies to all of us.
Performance Advertisements never give us the complete picture. One look at this and you might believe that all investors had to do was to invest in this fund to get this return. You might even believe that all investors who actually did invest in this fund would have got this return. In fact, you might be tempted to invest in this fund expecting a similar future performance. Neither did 99%+ investors get this performance for themselves and nor will you if all you do is look at performance and invest.
This brings me to the key lesson (the others are insights) of this post.
There is always a Gap between Investment Return and Investor Return. This Gap is beautifully illustrated by Carl Richard in his Sketch “Behavior Gap”.
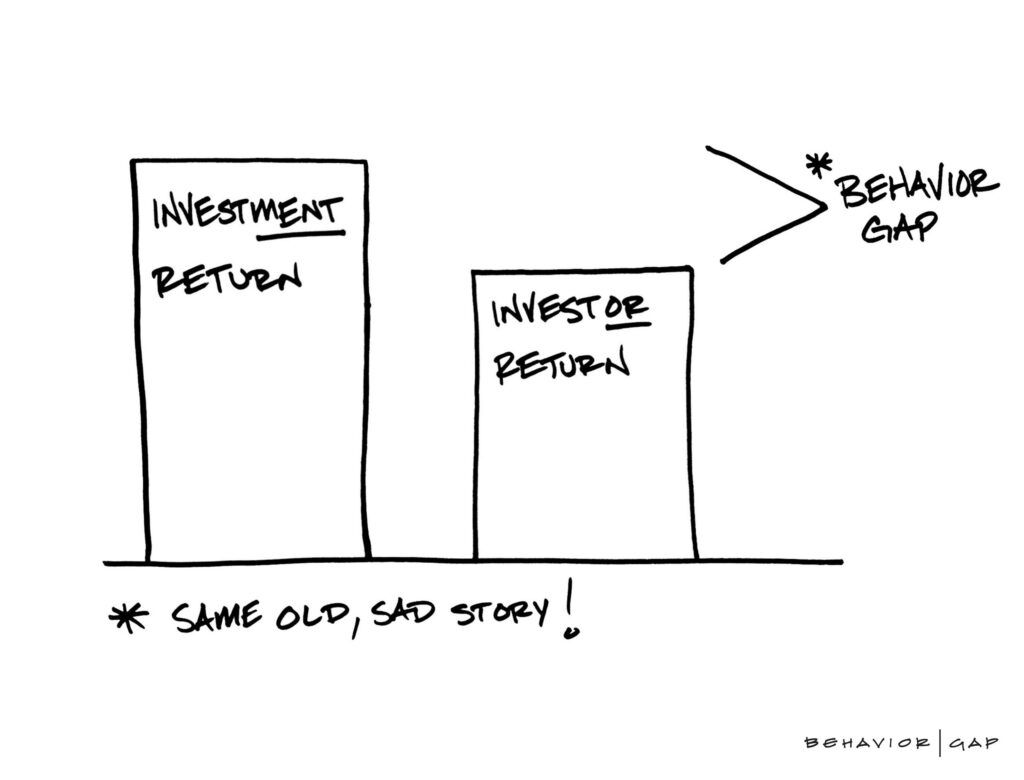
While the fund has delivered a 200X performance, how many investors have truly got this?
When I checked for details from the fund house (I will update as the details come), I figured out that less than 1% of the original investors are still with the fund. This means that 99%+ investors did not experience the Investment Return of 200X at all.
Thus, addressing the Behavior Gap is paramount for better financial outcomes. Well, it is easier said than done. This is why Real Financial Professionals exist. To help you reduce the Behavior Gap and in many cases even eliminate it.
There are some other thoughts that connect right back to the above Behavior Gap.
- After the first year of the fund, the NAV went down to Rs.9.44. This meant the first-year return of -5.6%. Though there is never a comparison between Fixed Deposits and Equities, many investors naively do so. Thus, I am taking the liberty to do it myself to simply highlight a point. 1995 was a time when Fixed Deposit Rates were around 15-17%. Can you imagine investing and then getting a negative return and yet sticking to the fund?
- There have been so many crises, corrections and crashes that have happened in the last 26 years. Despite all of this, the investment delivered. Now the big question is “Did this performance come in a linear fashion?” Absolutely Not. In fact, the performance of this fund can be categorized in 3 distinct phases. Before I share my thoughts on the 3 phases, kindly take a look at the NAV (Net Asset Value) movements of this fund year wise. I have also included the NAVs during the Global Financial Crisis.
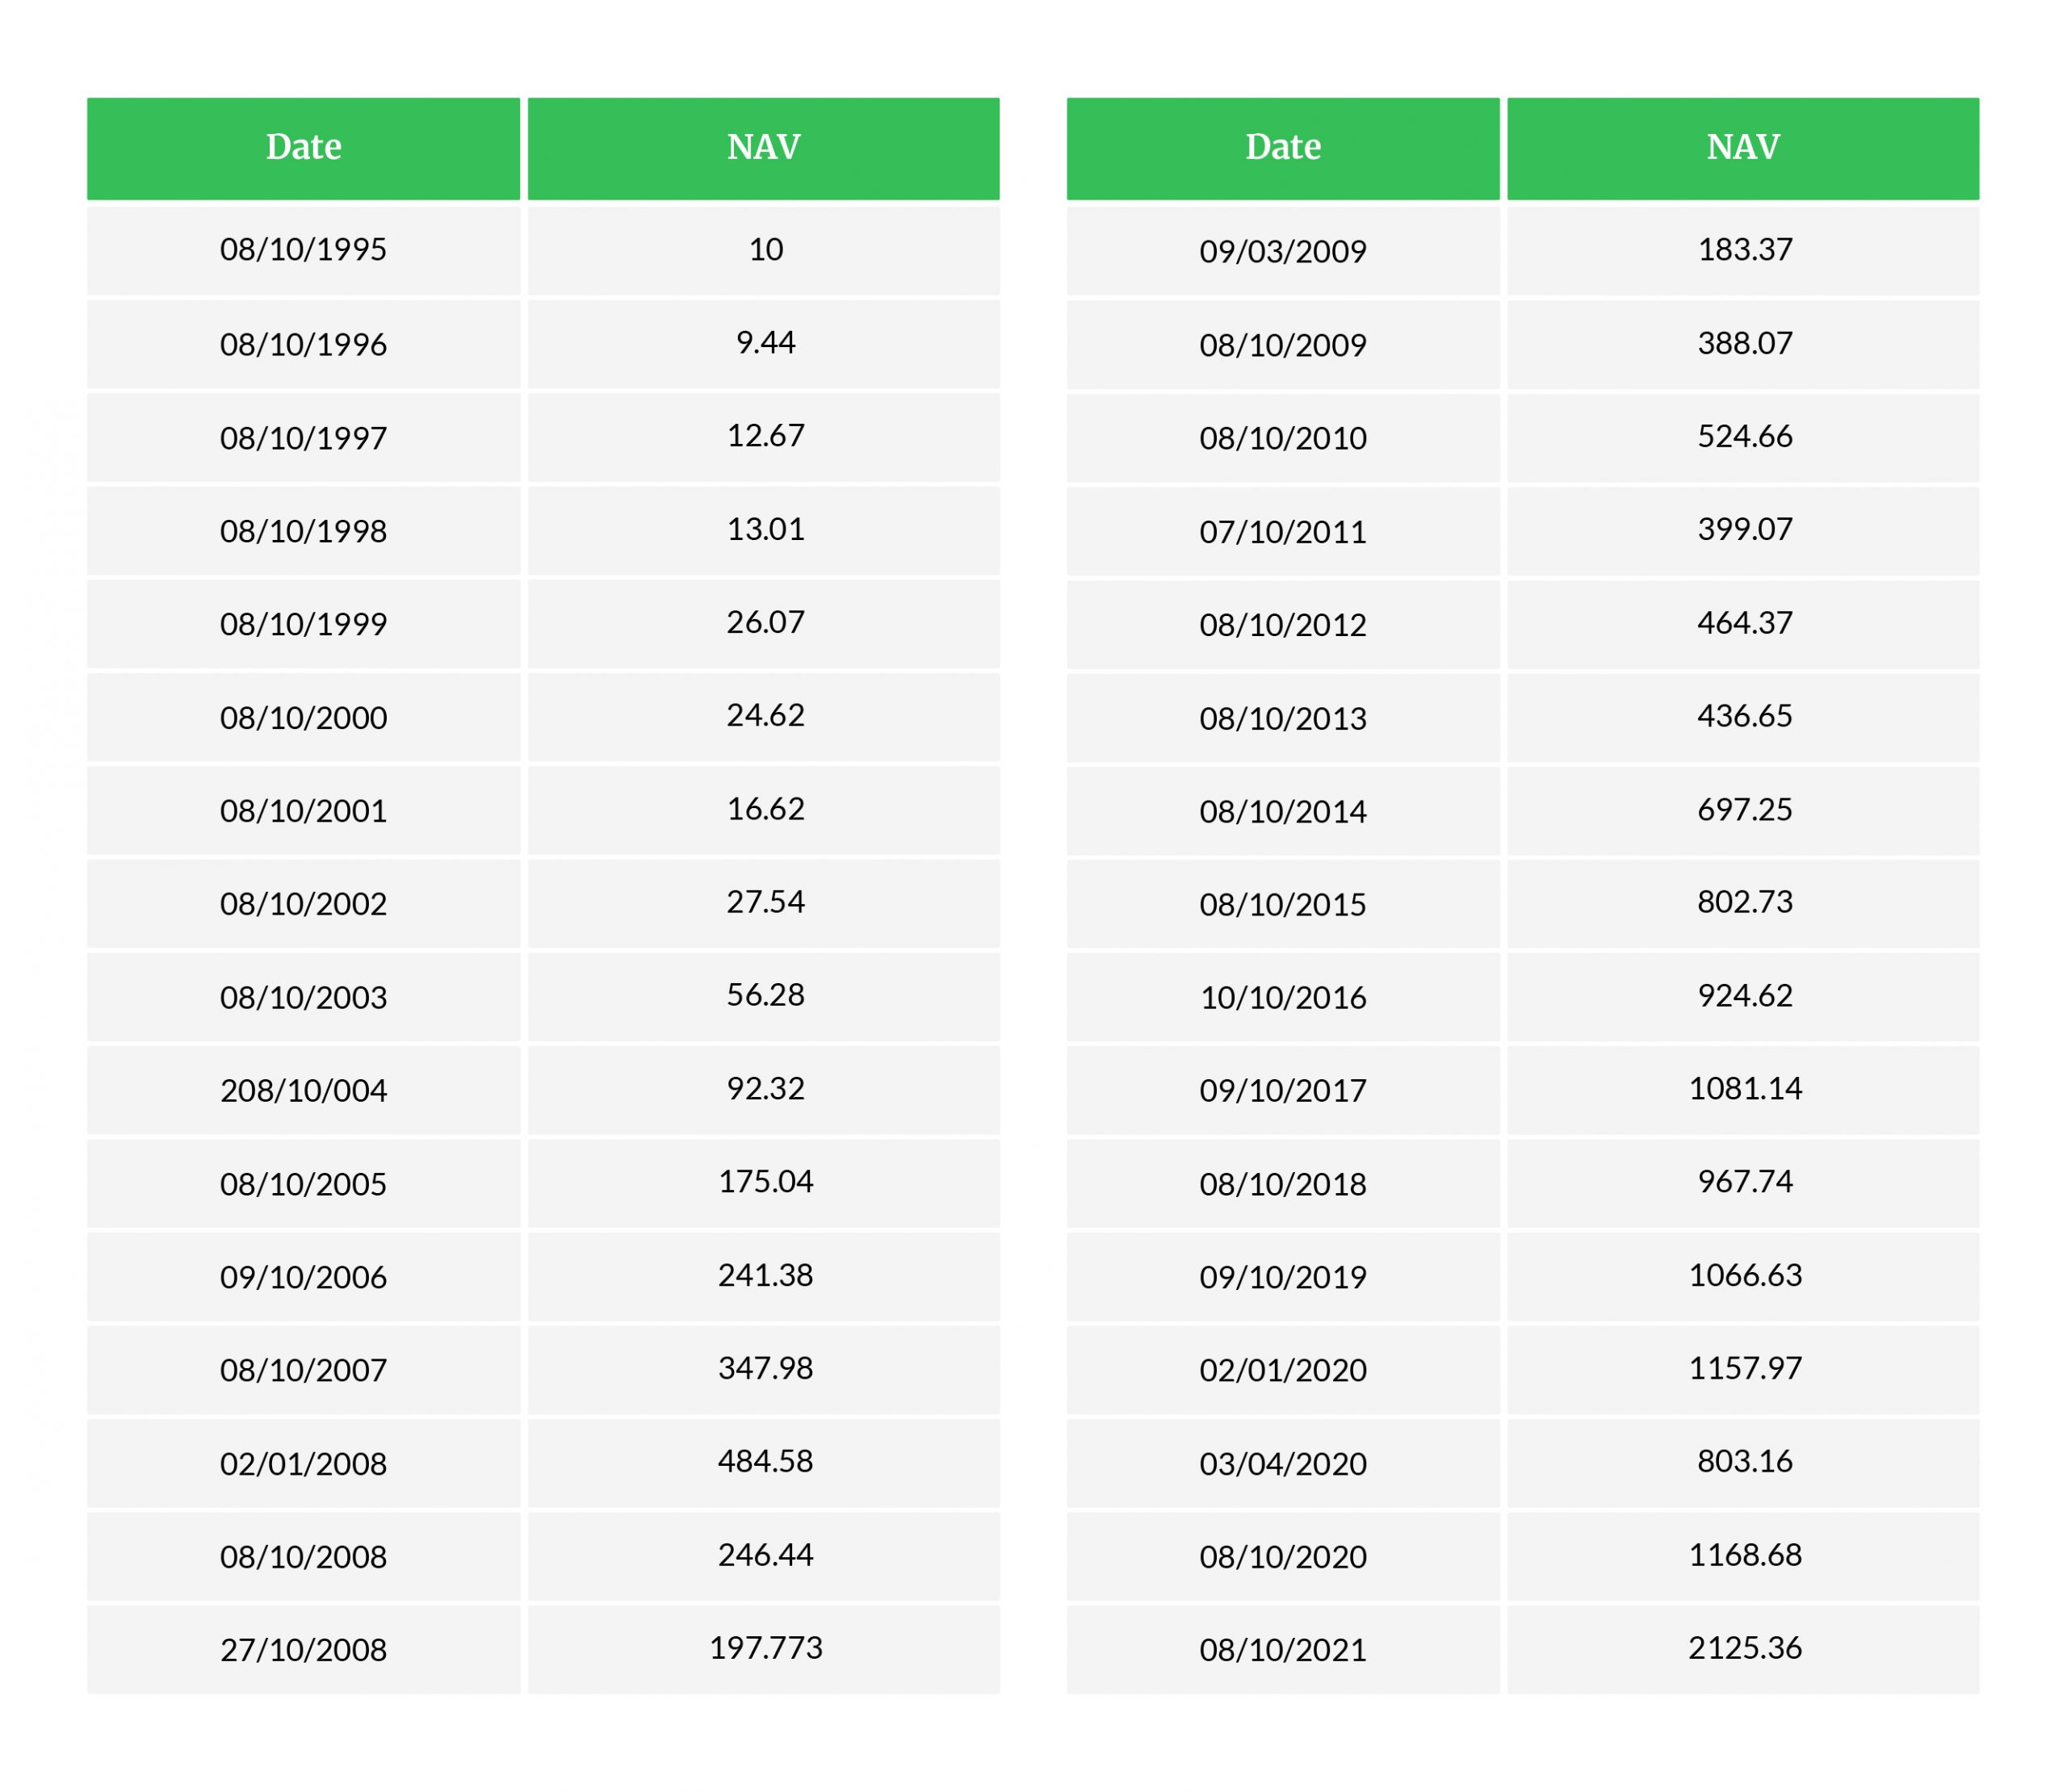
As you can see above, at the end of the 6th year (the first phase), the NAV was 16.62. This meant a CAGR of 8.84%. This was right after 9/11 had happened. The NASDAQ bubble had burst the previous year and the fund now seemed at a low point. Many would have exited way before this or during this rough patch. However, this seemed like the beginning of the most important jump for this fund and what I call the second phase. In the next 6+ years this fund went from a NAV of Rs.16.62 to Rs.484 on 2nd January 2008. The NAV on 8th October 2008 crashed all the way down to 246.44 and bottomed out at Rs.183.37 on 9th March 2009. This fund corrected by almost 62%. Despite this crash (as on 9th March), the fund was still up 18.3 times from 1995 and had delivered a CAGR of 25% p.a.
Within 7 months, on 8th October 2009, the fund was back at a NAV of Rs.388.07 and Rs.524.66 by 8th October 2010. Excluding the last 1 year, the 10 years from 08th October 2010 to 08th October 2020 have been similar to the first phase with a CAGR of 8.34% per annum.
There are 100 other ways to dissect performance and frankly speaking that is not the point.
The point is how many investors stuck to the fund through these ups and downs. As we know now, very few. According to Nippon’s internal data analytics, around 3% of the Folios remained invested for 15 years.
I am reminded of Crime Master Gogo’s dialogue from the movie “Andaz Apna Apna” – Haath to Aaya, Muh na Laga (It was in my hand, but I was not able to taste it or benefit from it) as I reflect on this.
P.S. Hats off to the investors (less than 1%) who stuck with the investment through various market cycles, let compounding work for the last 26 years and truly addressed the Behavior Gap.


 and then tap on
1 Comments