Have you heard of Goodhart’s law?

Satish Joshi
September 14, 2021 | 5 Minute Read
There are many ways in which it has been expressed but this one below is perhaps the most succinct and clear.
“When a measure becomes a target, it ceases to be a good measure.“
Because, then people find ways to increase their scores one way or another and in doing so always undercut the value of the measure for assessing what it was originally designed to assess.
For the last two years, every day, every newspaper has been printing all kinds of metrics about Covid-19 – most of which are quite misleading because the first impressions they cause (before you have a chance to dig into the calculation details) are either too pessimistic or too optimistic. In other words, a measurement that was designed to inform us about a real threat to our life becomes a tool for sensation mongering and selling more copies or attracting more clicks – for the newspapers these measures have become the targets to be chased!
For example, exactly one year ago a leading newspaper said that the overall rate of growth of new cases has come down now – so we need not worry even if we are recording the most number of cases in the world each day since the rate of growth is falling.
BUT THE RATE WILL FALL if we keep adding a record number of cases each day. And that does NOT mean things are improving! Here is a sample calculation. Start with a caseload of 100 and new cases found as 10 on that day. On each subsequent day the disease is spreading further. i.e., first day 10 new cases, 2nd day 11 new cases, 3rd day 12 new cases, 4th day 13 new cases and so on. Would you say in this case that the spread is under control? Clearly is it getting worse every day!
But instead of reporting numbers like this if I were to present (the same data) as – the rate of infections is 10% on first day, 10% on second day, 9.92% on third, 9.77% on fourth, 9.59% on fifth and only 8.16% on the 20th day. What would you conclude? Clearly the pandemic is reducing!
While summarizing large volumes of data, use of statistical calculations (such as averages, percentages, standard deviations etc.) is a very useful tool. Because our mind cannot grasp and make sense of the deluge of information which we are often subjected to. However, statistics can also be used to manipulate the messages that the data is supposed to convey to say whatever the narrator wants us to believe. And what is worse, as Charles Goodhart (an economist) noted while defining his law, is that “people will manipulate not just the numbers but even the activities which generate the numbers so that the numbers look good.”
For example, on the same Page in the newspaper I mentioned above right next to this “Don’t worry, rate of growth of Covid is falling” message, is a news item which reads, and I quote “Covid Tests Fall 40% to 6L on Sun, Lowest in two weeks“. Well, you don’t test, you don’t find new infections, numbers reported look great, everybody feels relieved, goes out without a mask and parties in an enclosed air-conditioned room, spreads Covid even more! So, if the target is to reduce rate of infections there are two ways in which one can do so – the easier is to do less testing – reducing the rate of infections becomes the target to be achieved and not reducing the infections themselves which is what the rate of infections is supposed to measure, exactly as Goodheart predicts!
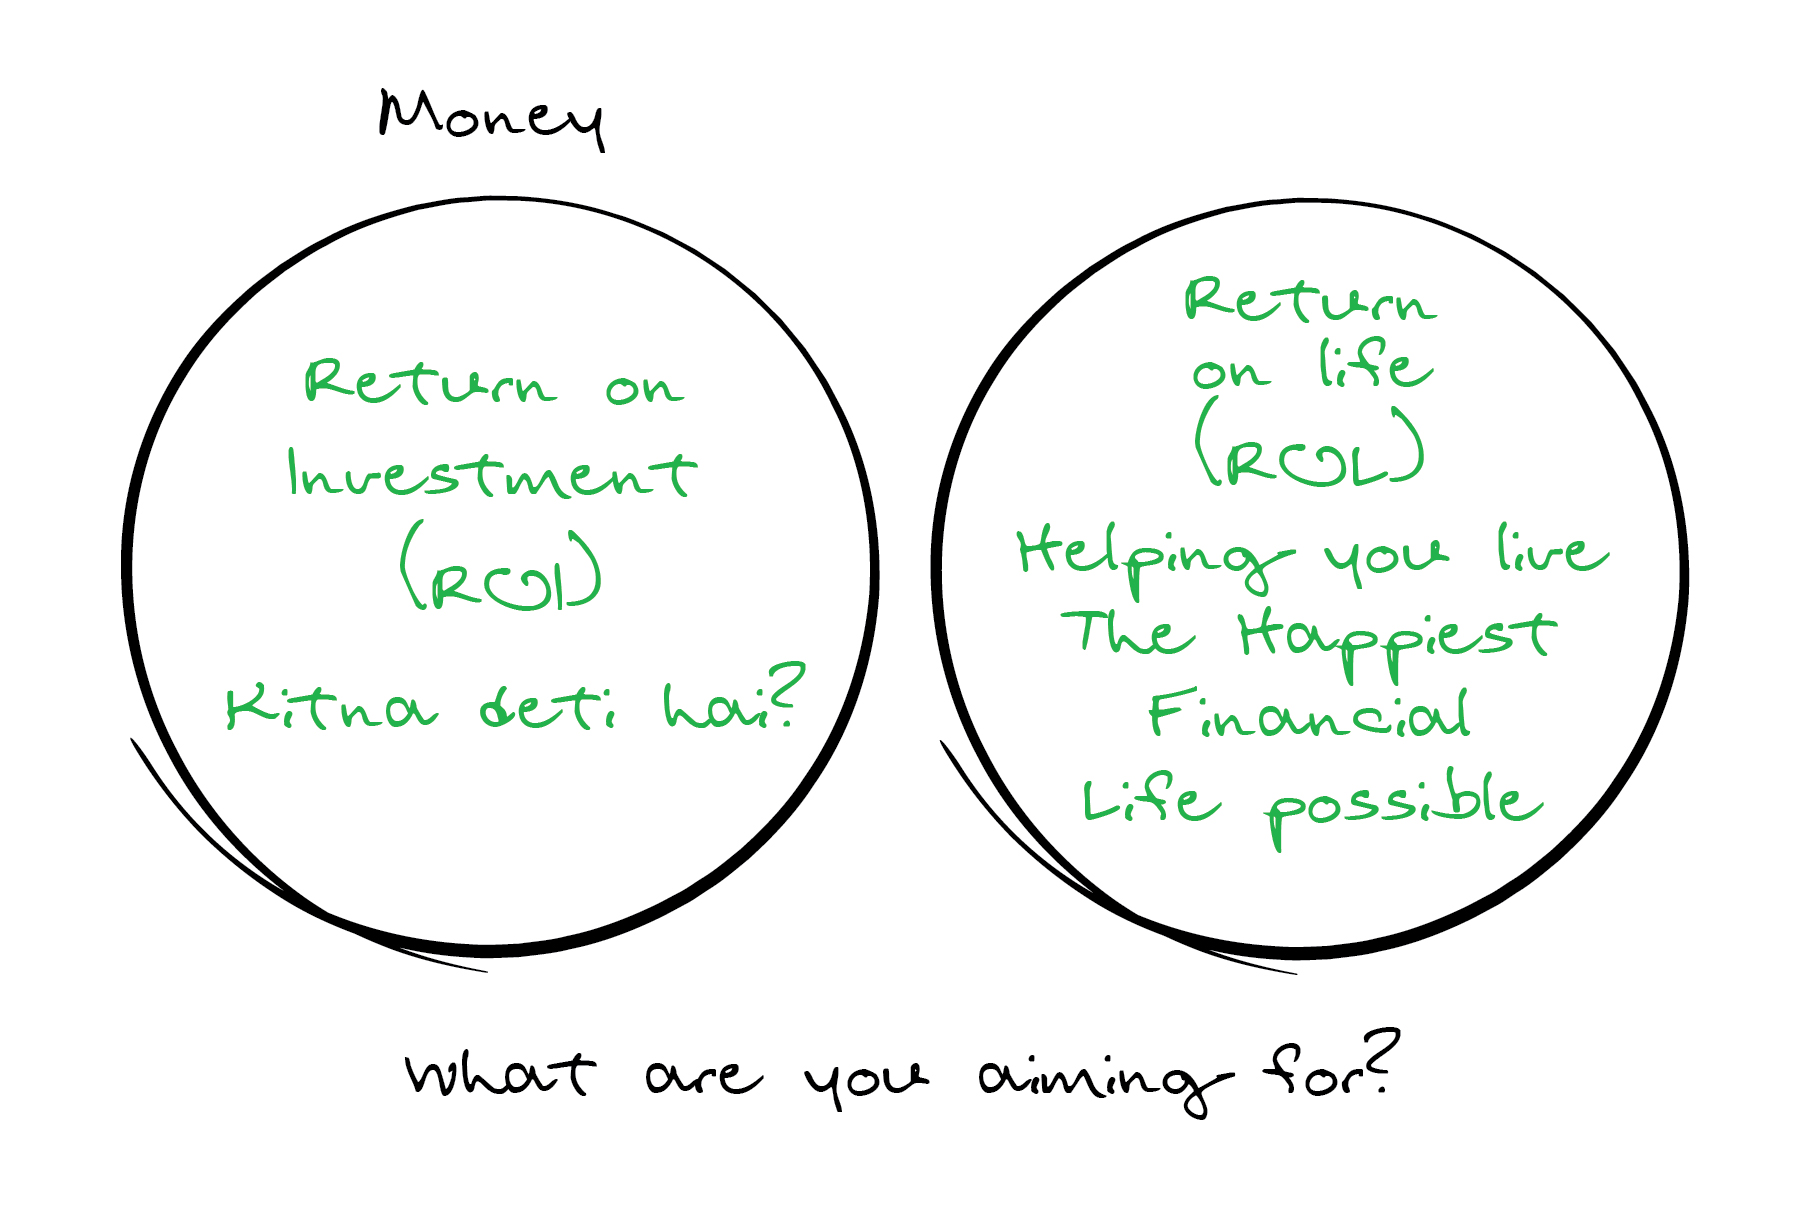
The return on your investments is a measure devised to inform you whether the purpose for which you are saving money is likely to be well served by those investments. Whether the goals which you are working hard to achieve are likely to be met. However, when the return on your investments itself becomes the target, you risk losing sight of the purpose and goals which you wanted to fulfil. Don’t let your actions be guided by the measure. Let them be focused on the real target!


 and then tap on
0 Comments