Did You Know This?
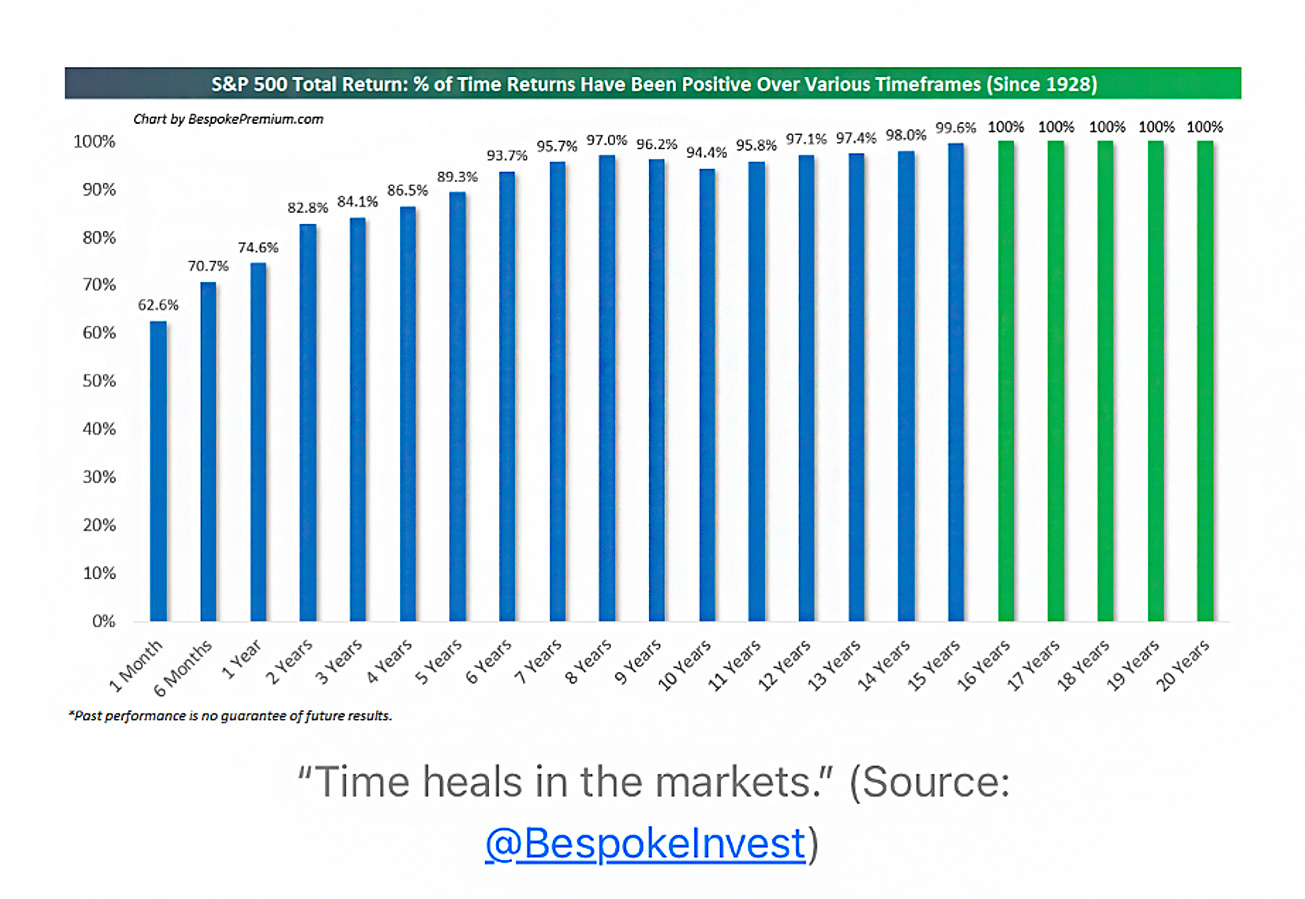
Kindly look at this interesting visual of the US S&P 500 Returns. This visual depicts the % of time the S&P 500 returns have been positive over various timeframes (since 1928).

This means that the US S&P 500 has been up 62.6% of the time for a one-month timeframe (since 1928). This number shoots up to 74.6% for a one-year timeframe.
What about the Indian stock markets? Let’s look at the Sensex data from 1979 till 2022 (44 years) Nifty’s data is available for only 26 years.
Of the 44 years, 33 have been positive return years and 11 have been negative return years. In terms of percentage, 75% have been positive return years, which is almost similar to what the US S&P 500 has done for around 96 years.
As we all know past performance is no guarantee of the future and the future might not play out like the last 5 decades. But the fundamental truth of the stock market is that the stock market usually goes up, that doesn’t mean it always does. There are times when it goes down or it is flat. Despite going down or remaining flat, the stock market usually goes up.
The key point is ‘Time Pays’. It’s the Secret Sauce. It’s the Magic Ingredient necessary to capture the asymmetric upside of the stock market. There is no other substitute.


 and then tap on

0 Comments