Some Fundamental Truths

Amar Pandit , CFA , CFP ![]()
July 11, 2023 | 5 Minute Read
Many in the US financial media seem to have suddenly changed track. Bloomberg (to be followed by other outlets later) called this (the stock market closing at 4,400…20% more than the October 2022 low of 3,600) a gravity defying bull market. Up until a few weeks back they were screaming about the imminent recession …intractable inflation…interest rate hikes… a collapse in corporate earnings…US Debt default (meaning the US will not be able to pay its creditors)…the US dollar becoming worthless…the banking crisis…geopolitical wars…Needless to say these financial Armageddon theories will continue as their business model depends on making you feel schizophrenic so you can keep clicking on the headlines all the time (thereby ringing the cash registers of these counters). While all of this is happening, some core fundamental truths are lost. This post hopes to shed some light on these fundamental truths…
Instead of writing this truth upfront, let me help you discover it with a visual and some data. Callie Cox, an US Investment Analyst shares a wonderful visual on the History of Bull and Bear Markets.
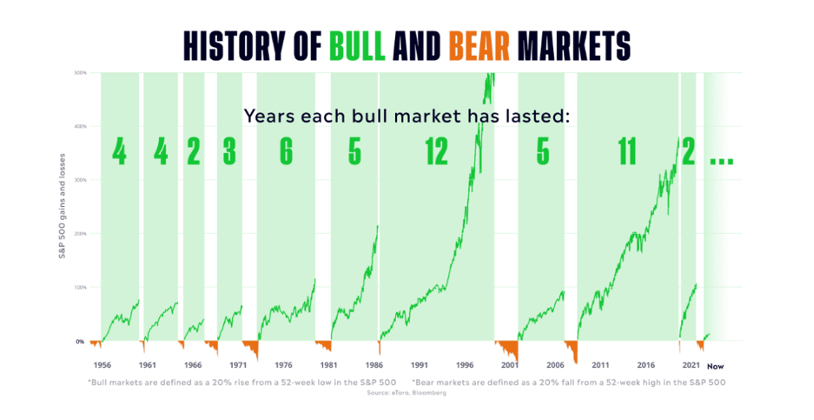
Look at this visual carefully…
What do you really see? Are you able to see the fundamental truths of the stock markets?
If you look at the visual above, there are 67 calendar years from 1956 till 2022. Of these 67 years, there are 54 bull market years and 13 bear market years. This means the stock market has been up for 54 years and down for 13 years as indicated by the red lines in the visual. In terms of percentage this translates to 80.6% for bull market years.
What about the Indian stock markets? Let’s look at what the Sensex data from 1979 till 2022 (44 years) tells us as Nifty’s data is available for only 26 years.
Of the 44 years, 33 have been bull market years and 11 have been bear market years. In terms of percentage, 75% have been bull market years.
Now if I look at the US S&P 500 data since 1979 (to compare it with the Sensex), then we see 35 bull market years versus 33 bull market years of the Sensex.
Callie makes an interesting observation about the US S&P 500 – “Bull markets have lasted for 5.5 years on average – four times as long as bear markets over the same stretch.”
The first fundamental truth as we see is that the stock markets mostly go up. As you can see from the data, the stock market does not spend 50% in the bull zone and 50% in the bear zone. It’s mostly in the bull market zone – mostly up.
At the same time the second truth is that the stock market does not always go up. While the bear market years point to this truth, the point that is missed is that even during bull market years, the stock market, while mostly going up, also goes down. And it is these days, weeks and months (supplemented by the constant media chatter) that cause many to stay out of the market or feel like waiting for the right time to invest.
The third fundamental truth is the one that I have mentioned in my previous post “The Next 300%”. It essentially says that the stock market offers an asymmetric upside. The money you invest in a diversified portfolio of stocks can only go down so much (you can fill in any number you want, 80% or even 100%… Just as an example, the Sensex went down by 52.45% in 2008) but the potential upside is unlimited. There is absolutely no limit to how much the value of your portfolio can go up to. The only thing that can limit this upside is your behaviour…It’s only limited if you interrupt compounding…else your portfolio can compound to ridiculous levels over a period of decades. If you don’t recollect the power of compounding, I would ask you to invest a few minutes in reading “The 500 Year Plan”.
Remember while everything above is history, there is no guarantee either that history will exactly repeat itself…As Mark Twain once said, “History never repeats itself, but it does often rhyme.”
The stock market too will not exactly repeat what has happened in the past, but it is likely to rhyme in the future.
Sam Ro in his newsletter TKer articulates the reason to rhyme well – “There are way more people who want things to be better, not worse. And that demand incentivizes entrepreneurs and businesses to develop better goods and services. And the winners in this process get bigger as revenue grows. Some even get big enough to get listed in the stock market. As revenue grows, so do earnings. And earnings drive stock prices.”
Yes, there is always the possibility of some risk emerging temporarily derailing earnings and stock prices. But even if that happens, the managers of these companies will take action to protect their earnings as many have (Google, Meta laying off thousands of workers) in anticipation of a recession. Even during the worst crisis of the last 100 years, we saw companies small and big immediately trying to figure out how to work through it… The point is that eventually with the passage of time earnings and dividends of companies will resume growing. And with that their stock prices.
In case you are still wondering whether we are in a bull market now, I guess you have completely missed the fundamental truths of the stock market…Well you have the choice of reading this post again and again till you understand them.


 and then tap on
0 Comments